Unlocking the Secrets of TradingView Indicators: A Comprehensive Guide on How to Share Signals

Introduction to TradingView Indicators
TradingView has emerged as one of the most popular platforms for traders, offering a wide range of tools and features such as strategy and indicator automation to enhance their trading experience. Among these tools, indicators play a crucial role in analyzing market trends, identifying potential trading opportunities, and making informed decisions. In this comprehensive guide, we will delve into the world of TradingView indicators, exploring their importance, the best ones available, and how to effectively utilize them for profitable trading.
Understanding the Importance of Indicators in Trading
Indicators are mathematical calculations that help traders analyze market data, identify trends, and predict future price movements. They provide valuable insights into market conditions, helping traders make informed decisions based on objective data rather than relying solely on intuition or emotions. By using indicators, traders can reduce the impact of subjective biases and increase their chances of success in the highly volatile and unpredictable world of trading.
Exploring the Best Indicators on TradingView
TradingView offers a vast library of indicators created by both the platform itself and its vibrant community of traders. These indicators cover various aspects of technical analysis, including trend following, momentum, volume, volatility, and more. Some of the best indicators on TradingView include:
- Moving Averages: Moving averages help traders identify trends and potential entry and exit points by smoothing out price data over a specified period.
- Relative Strength Index (RSI): RSI is a popular momentum indicator used to assess the strength and speed of price movements, indicating overbought or oversold conditions.
- Bollinger Bands: Bollinger Bands are volatility indicators that measure the deviation of price from its moving average, helping traders identify potential breakouts or reversals.
- MACD: The Moving Average Convergence Divergence (MACD) is a versatile indicator that combines moving averages and momentum to identify potential trend changes and generate buy/sell signals.
These are just a few examples of the wide array of indicators available on TradingView. It’s important to choose indicators that align with your trading style, time frame, and preferences.
How to Use Buy/Sell Indicators Effectively
Buy/sell indicators are specifically designed to generate signals indicating optimal entry and exit points in the market. However, it’s crucial to understand that no indicator is infallible, and using them blindly can lead to false signals and potential losses. Here are some tips to use buy/sell indicators effectively:
- Validate with other indicators: It’s recommended to use multiple indicators in conjunction with each other to confirm signals. For example, if a buy signal is generated by a moving average crossover, consider checking if the RSI also indicates oversold conditions.
- Consider market context: Indicators should be used in the context of the overall market conditions. A buy signal in a strong uptrend is likely to be more reliable than in a sideways or bearish market.
- Combine with price action analysis: Price action analysis involves studying the actual price movements on the chart. Combining buy/sell indicators with price action analysis can provide a more comprehensive view of the market and increase the accuracy of signals.
- Automate your indicator: Automating indicators in TradingView offers several advantages, including reduced human error, faster analysis, and real-time alerts, enhancing trading accuracy and efficiency. It allows for consistent application of trading criteria, and customization of indicators to suit individual preferences. Automation also enables 24/7 market monitoring, emotionless trading, and scalability to manage diverse portfolios.
Remember, buy/sell indicators are tools to assist in decision-making, but they should not be the sole basis for trades. It’s important to consider other factors such as risk management, fundamental analysis, and market sentiment.
Top Strategies for Using TradingView Indicators
Now that we have explored the importance of indicators and how to use buy/sell indicators effectively, let’s dive into some top strategies for using TradingView indicators:
- Trend following: Utilize indicators such as moving averages or Ichimoku Cloud to identify the prevailing trend and enter trades in the direction of the trend.
- Divergence trading: Look for divergences between price and indicators like RSI or MACD, as they can signal potential trend reversals or continuations.
- Support and resistance: Combine indicators with horizontal support and resistance levels to identify key price levels where the market is likely to react.
- Breakout trading: Use volatility indicators like Bollinger Bands or Average True Range (ATR) to identify potential breakouts from consolidation patterns.
- Multiple time frame analysis: Analyze indicators on multiple time frames to get a comprehensive view of the market and identify high-probability trading opportunities.
These strategies are just a starting point, and it’s essential to adapt them to your own trading style, risk tolerance, and market conditions.
Sharing Signals Using TradingView Indicators
One of the unique features of TradingView is the ability to share signals and analysis with other traders. This can be done through TradingView To Anywhere tools. Sharing signals not only allows you to contribute to the trading community but also gives you the opportunity to receive feedback, refine your own trading strategies, and earn from your strategies.
When sharing signals, follow the simple steps below:
-
Go to https://tradingview.to/anywhere and select your Trading platform.
-
Follow the instructions provided to create a webhook.
-
Add your webhook to your alerts in the webhook URL field. Remember to follow the Automation Guideline available under your Webhook Details.
-
Extend the webhook expiry and upgrade it to the Pro version, to enable alert sharing.
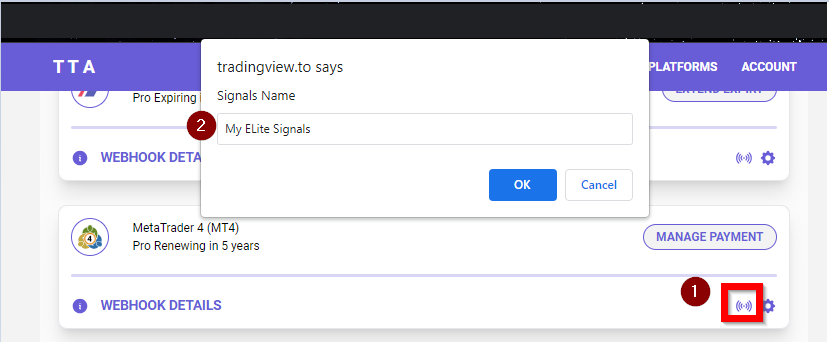
-
Click on the share icon and give your sharing list a name as shown here.
-
Refresh the page and go to the Alert copier section. Select Manage and add the webhooks of followers you want to copy alerts from your indicator.
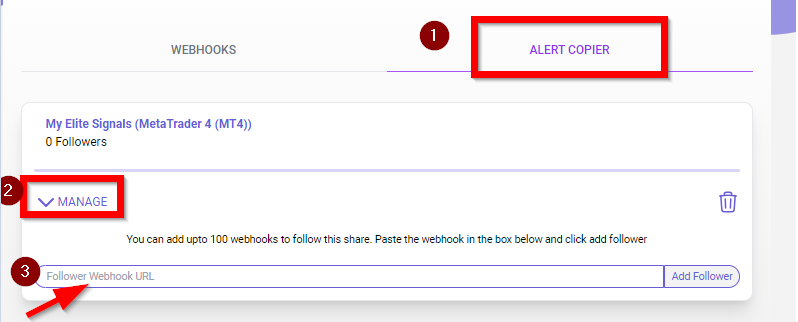
Your followers are now copying alerts from your TradinView indicator.
Conclusion: Unlocking the Full Potential of TradingView Indicators
TradingView indicators are powerful tools that can significantly improve your trading performance and decision-making process. By understanding their importance, exploring the best indicators, and learning effective strategies, you can harness the full potential of TradingView indicators to identify profitable trading opportunities.
Remember, indicators should be used as a part of a comprehensive trading approach that incorporates risk management, fundamental analysis, and market sentiment. They are not magic solutions but valuable tools to assist in your trading journey.
So, start exploring the vast world of TradingView indicators, experiment with different strategies, and share your signals with the trading community. Through continuous learning and practice, you can unlock the secrets of TradingView indicators and take your trading to new heights.
Unlock the full potential of TradingView indicators and elevate your trading skills today!